Downloading
IMDLIB is capable of downloading gridded rainfall and temperature (minimum and maximum) data. Here is an example of downloading rainfall data from 2010 to 2018:
import imdlib as imd

start_yr = 2010
end_yr = 2018
variable = 'rain' # other options are ('tmin'/ 'tmax')
data = imd.get_data(variable, start_yr, end_yr, fn_format='yearwise')
Output
Downloading: rain for year 2010
Downloading: rain for year 2011
Downloading: rain for year 2012
Downloading: rain for year 2013
Downloading: rain for year 2014
Downloading: rain for year 2015
Downloading: rain for year 2016
Downloading: rain for year 2017
Downloading: rain for year 2018
Download Successful !!!
The output is saved in the current working directory. If you want to save the files to a different directory, then you can use the following code:
import imdlib as imd

start_yr = 2010
end_yr = 2018
variable = 'rain' # other options are ('tmin'/ 'tmax')
file_dir = (r'C:\Users\imdlib\Desktop\\') #Path to save the files
imd.get_data(variable, start_yr, end_yr, fn_format='yearwise', file_dir=file_dir)
Reading IMD datasets
One of the major purposes of IMDLIB is to process IMD’s gridded datasets. The original data is available in grd file format. IMDLIB can read grd file in xarray and will create an IMD class object.
import imdlib as imd

start_yr = 2010
end_yr = 2018
variable = 'rain' # other options are ('tmin'/ 'tmax')
file_dir = (r'C:\Users\imdlib\Desktop\\') #Path to save the files
data = imd.open_data(variable, start_yr, end_yr,'yearwise', file_dir)
data
Output
<imdlib.core.IMD at 0x13e5b3753c8>
file_dirshould refer to top-level directory. It should contain 3 sub-directoriesrain,tmin, andtmax.If
file_direxists without any subdirectory, IMDLIB will look for the files infile_dir. But be careful if you are usingfile_format = ‘yearwise’, as it will not differentiate between the datasets,2018.grdfor rainfall and2018.grdfor tmin.If
file_diris not given, it will look for the adatasets from the current directory and its subdirectories.
Processing
Getting the xarray object for further processing:
ds = data.get_xarray()
print(ds)
<xarray.Dataset>
Dimensions:  (lat: 129, lon: 135, time: 3287)
Coordinates:
* lat      (lat) float64 6.5 6.75 7.0 7.25 7.5 ... 37.5 37.75 38.0 38.25 38.5
* lon      (lon) float64 66.5 66.75 67.0 67.25 67.5 ... 99.25 99.5 99.75 100.0
* time     (time) datetime64[ns] 2010-01-01 2010-01-02 ... 2018-12-31
Data variables:
    rain     (time, lat, lon) float64 -999.0 -999.0 -999.0 ... -999.0 -999.0
Attributes:
    Conventions:  CF-1.7
    title:        IMD gridded data
    source:       https://imdpune.gov.in/
    history:      2021-02-27 08:10:43.519783 Python
    references:
    comment:
    crs:          epsg:4326
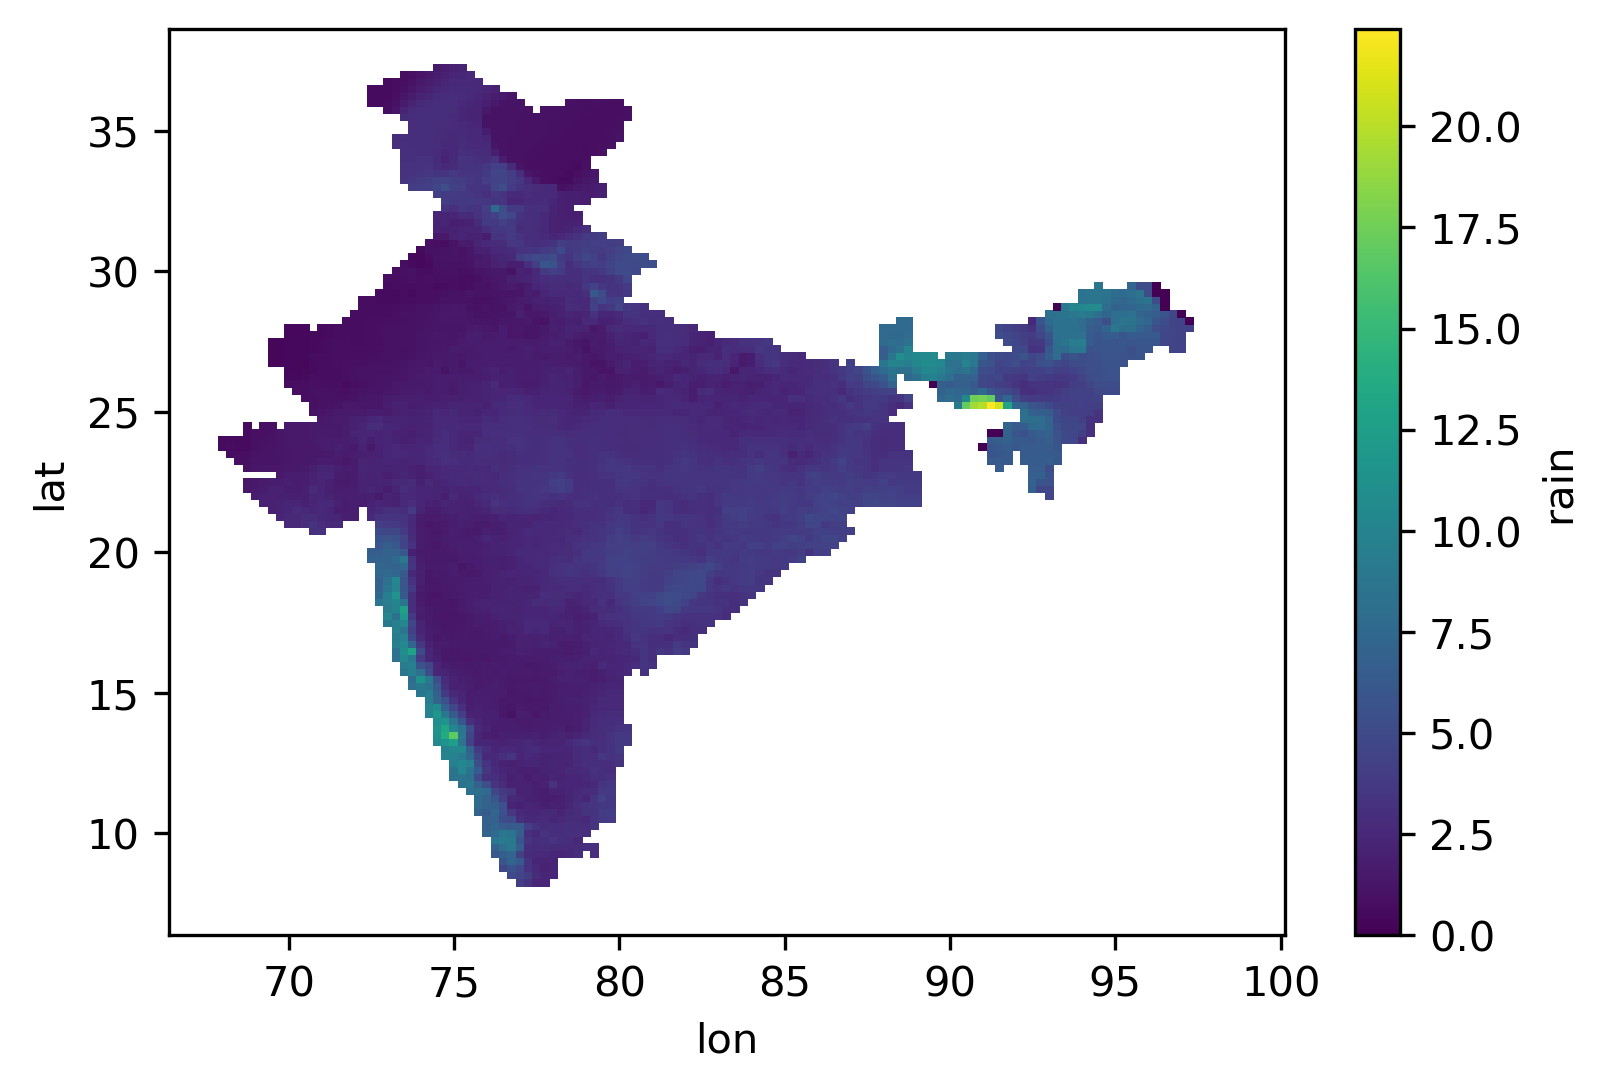
Plotting
Plotting can be done by:
ds = ds.where(ds['rain'] != -999.) #Remove NaN values
ds['rain'].mean('time').plot()
Saving
Get data for a given location, convert, and save into csv file:
lat = 20.03
lon = 77.23
data.to_csv('test.csv', lat, lon, file_dir)
Save data in netCDF format:
data.to_netcdf('test.nc', file_dir)
Save data in GeoTIFF format (if you have rioxarray library):
data.to_geotiff('test.tif', file_dir)
Gridded Data Real Time
Now IMDLIB can process Gridded (daily) Real Time data (Rainfall at 0.25o & Temperature at 0.5o spatial resolution)
Downloading
The steps are similar to the data downloading and opening of IMD gridded archive data
An example is presented below.
import imdlib as imd
start_dy = '2020-01-31'
end_dy = '2020-03-05'
var_type = 'rain'
file_dir='../data'
data = imd.get_real_data(var_type, start_dy, end_dy, file_dir)
Output
Downloading: rain for date 2020-01-31
Downloading: rain for date 2020-02-01
Downloading: rain for date 2020-02-02
Downloading: rain for date 2020-02-03
Downloading: rain for date 2020-02-04
Downloading: rain for date 2020-02-05
Downloading: rain for date 2020-02-06
Downloading: rain for date 2020-02-07
Downloading: rain for date 2020-02-08
Downloading: rain for date 2020-02-09
Downloading: rain for date 2020-02-10
Downloading: rain for date 2020-02-11
Downloading: rain for date 2020-02-12
Downloading: rain for date 2020-02-13
Downloading: rain for date 2020-02-14
Downloading: rain for date 2020-02-15
Downloading: rain for date 2020-02-16
Downloading: rain for date 2020-02-17
Downloading: rain for date 2020-02-18
Downloading: rain for date 2020-02-19
Downloading: rain for date 2020-02-20
Downloading: rain for date 2020-02-21
Downloading: rain for date 2020-02-22
Downloading: rain for date 2020-02-23
Downloading: rain for date 2020-02-24
Downloading: rain for date 2020-02-25
Downloading: rain for date 2020-02-26
Downloading: rain for date 2020-02-27
Downloading: rain for date 2020-02-28
Downloading: rain for date 2020-02-29
Downloading: rain for date 2020-03-01
Downloading: rain for date 2020-03-02
Downloading: rain for date 2020-03-03
Downloading: rain for date 2020-03-04
Downloading: rain for date 2020-03-05
Download Successful !!!
Reading
If the data is already downloaded. Read the real time gridded data.
import imdlib as imd
start_dy = '2020-01-31'
end_dy = '2020-03-05'
var_type = 'rain'
file_dir='../data'
data = imd.open_real_data(var_type, start_dy, end_dy, file_dir)
Climate Indices
Available cliimate indices are listed in a Table at the reference section of this documentation.
An example of computing heavy precipitation days between year 2015 and 2019 is as follows:
import imdlib as imd
start_yr, end_yr = 2015, 2019
variable = 'rain'
rain = imd.get_data(variable, start_yr, end_yr,'yearwise', '../data')
d64 =  rain.compute('d64', 'A', threshold=64.5)